Water consumption estimation model
Model principle
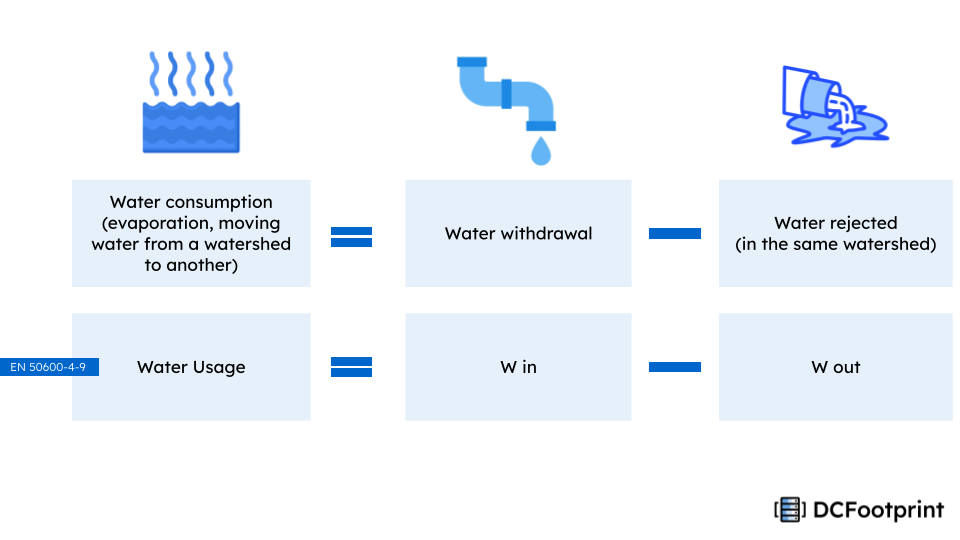
First base principle to assess the water consumption of a Datacenter is to make the difference between water withdrawal and water rejection after use. The water consumed is the difference between water coming into the system and water going out, which is defined in EN 50600-4-9 on Water Usage Effectiveness indicator.
DCFootprint assesses water footprint over 3 main scopes: direct usage for cooling and maintenance purpose, indirect usage due to consumed electricity production, indirect usage due to materials manufacturing.
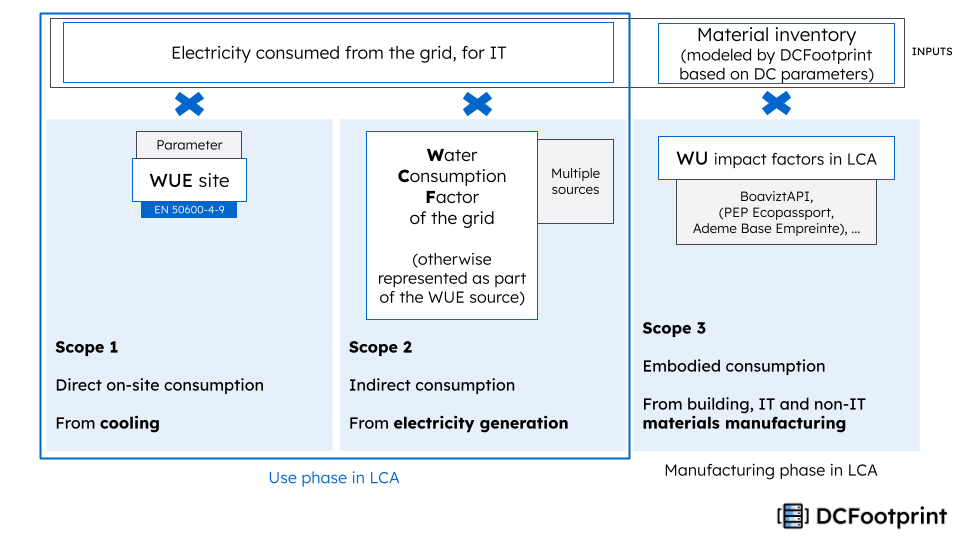
Direct usage, for cooling and maintenance purpose : “Scope 1”
This calculation is dimensionned mainly by the Water Usage Effectiveness parameter proposed by DCFootprint.
Scope1WaterConsumption(L) = ITElectricityConsumption(kWh) * WaterUsageEffectiveness_site(kWh/L)
With:
ITElectricityConsumption(kWh): calculated using the energy consumption model or calculated from the Total (yearly) Electricity Consumption as the total electricity consumption divided by the Power Usage EffectivenessWaterUsageEffectiveness_site(kWh/L): given as the Water Usage Effectiveness parameter
Indirect usage, due to electricity production : “Scope 2”
The indirect consumption of water, due to electricity production is computed with the formula:
Scope2WaterConsumption(L) = TotalElectricityConsumption(kWh) * LocalGridWaterIntensity(L/kWh)
With:
TotalElectricityConsumption(kWh): calculated using the energy consumption model or directly given as the Total energy (IT + facility), for one year parameterLocalGridWaterIntensity(L/kWh): a water intensity factor for the country of implantation. DCFootprint uses WRI’s factors.
Indirect usage, due to materials manufacturing process: “Scope 3”
This part includes the water consumption that happened during the manufacturing process of the materials and hardware in the Datacenter.
In the current version of the methodology DCFootprint only accounts for the IT hardware manufacturing process water consumption, not for the building materials, nor for the non-IT technical environement gear and materials.
Water stress normalization
⚠️ In future version of the methodology, those volumes consumed will be weighted depending on the local zone water stress. This is not the case in the current version.
Litterature review
To explore
AI Data Centers and the Water Use Feedback Loop, Akinade et al. 2026
Data centre water consumption, Mytton, 2021
0.00–4.4 L/kWh (consumption) ; 0.31–533.7 L/kWh (withdrawal)
Calculates:
- an average WUE for Google datacenters of 1.04 L / kWh.
- 3.40 L/kWh average for big tech’s datacenters in the USA
- 4.80 L/kWh average for Apple and Meta datacenters in the USA
Includes tables of available reported data per USA and China big tech company.
Thus, based on available sustainability reporting, the IEA could be significantly underestimating the water footprints of data centers. the total water footprint of AI systems alone could reach between 312.5 and 764.6 billion L in 2025 the uncertainty surrounding these figures would also remain significant because the power grids supporting the specified United States data center locations of Apple, Google, and Meta can be associated with water intensities ranging from 0.68 to 11.98 L/kWh
2024 United States Data Center Energy Usage Report, Shehabi et al. 2024
Averages a direct consumption of 0.45–0.48 L/kWh (projection >2023).
Averages 4.52 L/kWh of indirect consumption (electricity production) for USA datacenters in 2023.
Myths vs. Reality: Data Centers And Water Usage, fwpcoa, 2026
data centers can evaporate 1–9 liters of water per kWh of energy used
Averages 3.14 L/kWh for datacenters in the USA.
With good water quality, roughly 80% of water withdrawal is evaporated and considered “consump- tion”
citing Google reports.
Typical ranges:
- 1.8 L/kWh — traditional evaporative cooling, hot/humid climate. Most colocation and older hyperscale.
- 0.7-1.2 L/kWh — well-tuned evaporative cooling, moderate climate.
- 0.1-0.4 L/kWh — adiabatic / air-assisted cooling, modern design.
- <0.05 L/kWh — fully air-cooled or closed-loop liquid cooling.
The Water Footprint of Data Center Workloads: A Review of Key Determinants, Lei et al. 2024
The environmental footprint of data centers in the United States, Sddik et al, 2021
For water consumption data by electricity generation technologies
-
Water use of electricity technologies: A global meta-analysis, 2019
-
Further research to be done on impact factors for electricity water intensity that go beyong WRI impact factors