Welcome on DCFootprint documentation

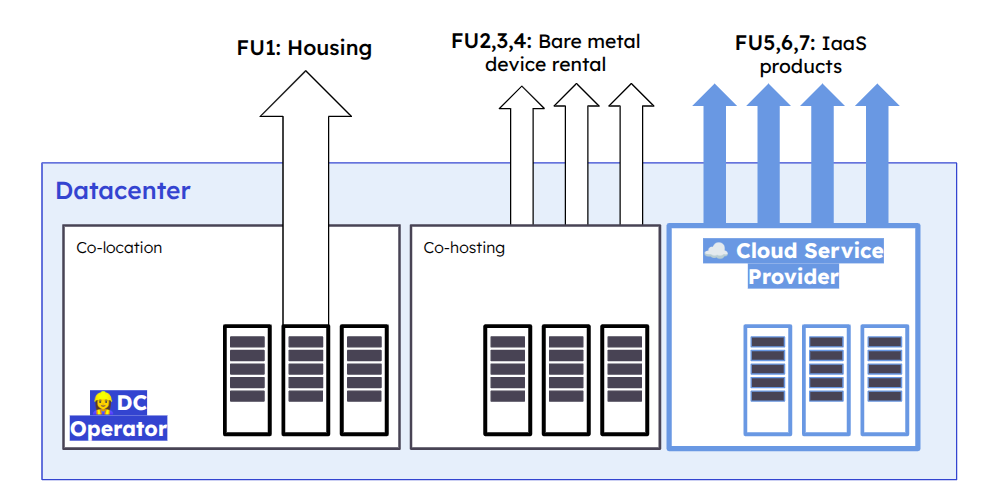
DCFootprint gives a way to simply assess the environmental impact of datacenters and of the services they offer, be it colocation services (being able to install physical IT devices and operate them in a rack that has power and cooling guaranteed) or Cloud services (consuming digital ressources for hosting and building online services, on demand).
DCFootprint aims to implement the state-of-the-art standards of multi-criteria and lifecycle wide environmental impact assessment for Datacenter, Cloud and GenAI infrastructure services. In this regard, it respects the Product Category Rule for data centre IT hosting services and cloud services a.k.a the “PCR for Cloud & Datacenters”, from ADEME. Accordingly to this PCR, DCFootprint provides per-service evaluation that matches generic colocation or Cloud services.
How to navigate this documentation
To get a quick start using this project, directly jump to the tutorials section.
If you need more in-depth, use-case oriented instructions, the how-to guides are here for you.
Explanations part is about concepts behind DCFootprint, the methodology used for impact calculation and the reasons for the technical choices that have been made so far.
If you are already using, hacking or exploring DCFootprint and need precise informations about one of its components, go to the references section.
About this project
DCFootprint has been initiated by Hubblo a cooperative dedicated to the socio-ecological transition of the digital sector.
![]()
It is supported by the 2025 edition of the digital commons support program “Leverage the commons for the ecological transition”.
![]()
We warmly thank the french governmental agency ADEME for financing this program and thus this project.
![]()
Contributing to the documentation
The source of the documentation website is in the docs/ folder of the main DCFootprint repository.
To contribute to the documentation you just need to:
- Install mdbook
- Fork the DCFootprint repository
- Clone it locally
- Move into the docs folder:
cd docs - Run the demo server locally to see the result of your changes:
mdbook serve - Open a browser to see your changers happening on http://localhost:3000
- Once your are satisfied with the new content, commit and push on your own fork version of the repository
- Open a merge-request on Gitlab
Contributing to the code 👩🏾💻
- Identify the problem you want to fix or feature you want to add 💡
- Search for an issue or merge request that could exist because of the same reason 🔎
- Add your perspective to the issue or the merge request, start a discussion with the people who started it 💬
- If there is none for this topic, open a new issue, select if this is an issue to be fixed (a bug) or a task to be done (a feature or improvement request) ✨
- Describe your issue or intended feature in the description: what you want to see, why you want this to happen, how it may or will be made 📋
Contributing to the methodology
Here is the procedure to suggest a change or a improvement in the methodology:
- Open a new thread on the DCFootprint’s community forum with the “Methodology” label.
- Describe what you think might happen in DCFootprint, precising if this is about
- Impact factors used
- Calculation formulas
- Perimeter definition
- How the calculations are described in the documentation
How FU0 - Operating a Datacenter during 1 year - works
Introduction
DCFootprint estimates the environmental impacts of the life cycle of the Datacenter, depending on its generic description (based on the input parameters), before computing the share of impact of each other Functional Unit.
This Functional Unit “0” is not defined in the Ademe Cloud & Datacenter PCR, but we choosed to present this part as a functional unit as well to make it more explicit and usable independantly from the other Functional Units.
Version 1
This is the very first version of the methodology. It will evolve in the future, but version 1 will remain usable, in order to be able to compare results between each model version.
To discuss about this methodology and how it should evolve, please look for an existing thread or open a new one, on community.dcfootprint.org.
Life Cycle coverage and respect of norms
| Environmental display - Life Cycle stage | ITU L.1410 - Life Cycle stage | Coverage in Ademe Cloud & DC PCR | Coverage in this Functional Unit |
|---|---|---|---|
| 🏗️ Manufacturing | Raw materials extraction | Mandatory | ✅ see the methodology section for details |
| 🏗️ Manufacturing | Raw materials processing | Mandatory | ✅ see the methodology section for details |
| 🏗️ Manufacturing | IT equipment production - Component production | Excluded from this functional unit (see FU2, FU3 and FU4) | Excluded |
| 🏗️ Manufacturing | IT equipment production - Assembly | Excluded from this functional unit (see FU2, FU3 and FU4) | Excluded |
| 🏗️ Manufacturing | IT equipment production - Support activities of IT equipment manufacturers | Excluded from this functional unit (see FU2, FU3 and FU4) | Excluded |
| 🏗️ Manufacturing | Support goods manufacturing | Mandatory | ✅ see the methodology section for details |
| 🏗️ Manufacturing | Construction of ICT specific site | Mandatory | ✅ see the methodology section for details |
| 🚚 Distribution | Mandatory | ✅ see the methodology section for details | |
| 🔧 Installation | Optional | ✅ see the methodology section for details | |
| ⚡ Use | IT equipment use | Excluded from this functional unit (see FU2, FU3 and FU4) | Excluded |
| ⚡ Use | Support goods use | Mandatory | ✅ see the methodology section for details |
| ⚡ Use | Operator support activities | Mandatory | ✅ see the methodology section for details |
| ⚡ Use | Service provider support activites | Excluded | Excluded |
| 🗑️ End of life | Preparation of ICT equipment for reuse | Mandatory | Excluded 1 |
| 🗑️ End of life | Storage / Disassembly / Dismantling / Shreding | Mandatory | ✅ see the methodology section for details |
Methodology
Calculation summary
| Perimeter | Impact factors - Manufacturing | Impact factors - Distribution | Impact factors - Use | Impact factors - End of life |
|---|---|---|---|---|
| ❄️⚡🔒 Technical environment | ✅ See Technical environment | ✅ See Technical environment | ✅ See Technical environment | ✅ See Technical environment |
| 🏢 Building architecture | ✅ See Building architecture | ✅ See Building architecture | ✅ See Building architecture | ✅ See Building architecture |
| 💻 IT equipments | ❌ Excluded, see IT equipments | ❌ Excluded, see IT equipments | ❌ Excluded, see IT equipments | ❌ Excluded, see IT equipments |
| 🌳 Outdoor infrastructure | ❌ Not accounted, see Outdoor infrastructure | ❌ Not accounted, see Outdoor infrastructure | ❌ Not accounted, see Outdoor infrastructure | ❌ Not accounted, see Outdoor infrastructure |
❄️⚡🔒 Technical Environment
Life Cycle Inventory
🏗️ Manufacturing
impact_manuf_par_kw_vendu * total_kw_vendu_datacenter
🚚 Transport
impact_transport_par_kw_vendu * total_kw_vendu_datacenter
⚡ Use
(PUE - 1) * total_yearly_consumption * impacts_elec_selon_mix
- total_L_diesel * impact_use_diesel
🗑️ End Of Life
impact_eol_par_kw_vendu * total_kw_vendu_datacenter
🏢 Building Architecture
Life Cycle Inventory
🏗️ Manufacturing
impact_manuf_par_m2 * m2_surface_datacenter
🚚 Transport
impact_transport_par_m2 * m2_surface_datacenter
⚡ Use
🗑️ End Of Life
impact_eol_par_m2 * m2_surface_datacenter
💻 IT Equipments
This functional unit doesn’t consider IT equipments for or from customers of the Datacenter.
🌳 Outdoor infrastructure
This functional unit doesn’t consider anything else than the datacenter building itself in version 1.
Version 2
Planned for 2026.
-
The mandatory caracteristic of this item is an error in the original Cloud & Datacenter PCR. ↩
How FU1 - “Colocation” - works
How FU2 - "Bare metal server" - works
How FU3 - "Bare metal network" - works
How FU4 - "Bare metal storage server" - works
How FU5 - "Compute capacity" - works
How FU6 - "Virtual Machine / Cloud instance" - works
How FU7 - "Database" - works
How FU8 - "Custom" - works
How is the IT inventory modelled from basic datacenter parameters ?
How many racks can fit in a given surface ?
nb_racks = IT_surface * racks_per_square_meter_ratio
With:
racks_per_square_meter_ratio: ratio of how many racks can fit in 1 m² of surface - unit: # racks / m²IT_surface: the floor area dedicated to hosting IT devices, aka IT rooms - unit: m²nb_racks: the number of racks modelled from previous parameters - unit: # of racks
To compute racks_per_square_meter_ratio we consider a sample average rack1: 19 inches large, 42 inches deep, (and 42 Units high but this is not relevant in this formula).
Let’s consider:
rack_width=0.4826 # metersbeing 19 inchesrack_depth=1.0668 # metersbeing 42 inches
The floor area occupied would be:
rack_floor_occupation = rack_width * rack_depth
In our example:
rack_floor_occupation = 0.51483768 # square meters / m²
rack_per_square_meter_ratio = rack_floor_occupation * available_rack_floor_usage_ratio
With:
available_rack_floor_usage_ratio: a ratio representing the share of an IT room floor area really available for racks (excluding free space for aisles, cooling system equipments, etc.)
We consider a value of 0.5 for this ratio.
Then rack_per_square_meter_ratio = 0.5 * 0.51483768 = 0.25741884
How many servers are modelled in a rack ?
We consider the load_factor parameter as a proxy for the occupation ratio of the racks.
Warning
Using the load_factor both as a ratio for install electric power usage and as a ration for rack occupation is a highly incomplete approach. This will be improved in the future versions of the methodology.
nb_devices = nb_racks * rack_height_units * load_factor
Example
: Let’s consider a Datacenter with 2000 m² of IT floor area and a load_factor or 0.4:
nb_racks = IT_surface * racks_per_square_meter_ratio

nb_racks = 2000 * 0.25741884 = 514.83768 # 515 racks
nb_devices = nb_racks * rack_height_units * load_factor

nb_devices = 515 * 42 * 0.4 = 8652
In the current state of the methodology, we don’t differentiate servers from other kind of devices : network devices, security appliances, etc. This model considers that only servers are installed in a rack. This will be improved in the next versions.
Challenging this model with external sources
The number of servers can be a structuring variable. As limited as is the model in its current form, we’ll do our best to challenge it at earch iteration of its evolution.
OneChassis2 says there is an average number of 40-60 servers in an Hyperscaler Datacenter, and an average of 20-40 servers in an Enterprise Datacenter. Considering a 42 Units high rack, the highest range of 60 servers certainly implies the usage of blade-format servers or custom design made by cloud operators, that enable a server to take lesss than 1 full Unit in the rack. The current DCFootprint model is a multiplication of rack_height_units and load_factor. As we consider a fixed value of 42 for rack_height_units, the number of servers per racks is between 0 (for a load_factor of 0) and 42 (for a load_factor of 1). This seems acceptable to describe a common datacenter, even if limited to describe a Datacenter of very high density.
Comparing to CC WaveTech estimates of maximum number of servers in a large scale datacenter 3:
| Facility Size | Estimated Max Servers (1U) | DCFootprint Estimated Max Servers | DCFootprint estimate / CC Tech Group estimate * 100 |
|---|---|---|---|
| 27871 (300,000 sqft) | 500,000 | 150664 | 30.1328 |
| 92903 (1,000,000 sqft) | 2,688,636 | 502214 | 18.67913693 |
| 668902 (7,200,000 sqft) | 6,314,256 | 3615947 | 57.26639845 |
DCFootprint applying the formula: facility_size/2*0.25741884*42*1
Based on this source, DCFootprint seems conservative regarding the maximum number of servers in a large scale Datacenter. It might then undersetimate the impact of their manufacturing (or “embedded footprint”).
A comparison based on power capacity remains to be done with the Shneider Electric Power Sizing Calculator 4.
Current limitations summary
This modelization of a possible IT inventory based on surface metrics has, at least, the following limits, that are to be improved in the next releases:
- considering only IT servers, not other IT equipments
- considering an average server as the base for manufacturing footprint evaluation
- two ratios are used that can shall be challenged and improved: the conversion ratio from total floor area to IT floor area, and
available_rack_floor_usage_ratio - it is currently limited to estimate the impacts of higher density datacenters, both in terms of server count and power density